

What if the highest-rated pump in your inventory is the direct cause of your facility's recurring mechanical failures? Industrial operators often select equipment based on peak capacity alone, yet this approach frequently leads to chronic cavitation or excessive energy waste. You likely recognize that an oversized pump is just as detrimental to your operational budget as an undersized unit, particularly when calculating friction losses in complex pipe manifolds.
Mastering the pump system curve vs pump performance curve is the only way to identify the precise duty point where your equipment achieves optimal efficiency. This guide provides the technical framework required to balance system resistance against pump capability. We'll analyze the impact of static head and dynamic friction while utilizing current 2026 standards like ASME B73.1 to ensure hardware longevity. You will learn to select Goulds Water Technology Pumps that align with your specific hydraulic demands, eliminating the mechanical strain that compromises industrial water systems and leads to premature seal failure.
Key Takeaways
- Understand the fundamental difference between a pump system curve vs pump performance curve to pinpoint the exact hydraulic operating point of your facility.
- Calculate Total Dynamic Head (TDH) by aggregating static head and dynamic friction losses to define your unique system resistance profile.
- Identify the Best Efficiency Point (BEP) on manufacturer data sheets to ensure long-term mechanical reliability and reduced energy expenditure.
- Analyze Net Positive Suction Head Required (NPSHr) to prevent cavitation and avoid premature damage to impellers and seals.
- Utilize precise curve alignment when selecting Goulds Water Technology Pumps for modular industrial water treatment systems to guarantee performance stability.
What is the Difference Between a System Curve and a Pump Performance Curve?
Industrial hydraulic design relies on the precise interaction between equipment capability and infrastructure demand. To achieve efficiency, engineers must distinguish between the pump system curve vs pump performance curve. One represents what the pump is capable of delivering, while the other represents what the piping network requires to move fluid. Analyzing these two curves together is essential for hydraulic balance. Without this comparison, you risk selecting a pump that operates far from its design intent, leading to catastrophic failure or wasted energy.
The primary metrics for this analysis are Flow Rate, typically measured in Gallons Per Minute (GPM), and Total Dynamic Head (TDH). These variables form the X and Y axes of the hydraulic chart. Balancing these values prevents common industrial failures like motor overload or seal degradation. In 2026, where energy costs remain a primary operational concern, precise curve alignment is a requirement for fiscal responsibility. Don't assume a high-capacity pump is the best fit for your specific manifold without plotting both curves.
The Pump Performance Curve: Potential Energy
Manufacturers like Goulds Water Technology generate specific data through rigorous factory testing under controlled conditions. A pump performance curve illustrates the relationship between the head the pump produces and the flow rate it delivers at a specific impeller speed and diameter. It's a snapshot of the machine's potential energy output.
As the flow rate increases, the head produced by the pump decreases. This inverse relationship is a physical constant of centrifugal design. These charts also include critical performance indicators that dictate the service life of Goulds Water Technology Pumps:
- Best Efficiency Point (BEP): The specific flow rate where the pump operates with the least internal turbulence and radial thrust.
- Net Positive Suction Head Required (NPSHr): The minimum pressure needed at the suction port to prevent vapor bubbles from forming and collapsing.
- Brake Horsepower (BHP): The actual power required from the motor to drive the pump at a given duty point.
The System Curve: The Resistance Framework
The system curve is a mathematical representation of the resistance the pump must overcome to move liquid through your specific manifold. Unlike the performance curve, which is fixed by the pump's physical geometry, the system curve is unique to every industrial site. It's the "demand" side of the hydraulic equation. It consists of two primary components: Static Head and Dynamic Friction Loss.
Static Head is the vertical distance the fluid must be lifted from the source to the discharge point. This value is constant regardless of flow. Consequently, the system curve always starts at the "Static Head" point on the Y-axis rather than at zero. Dynamic friction loss, however, increases exponentially as the flow rate rises. Factors like pipe diameter, Hazen-Williams coefficients for HDPE or stainless steel, and valve configurations determine the curve's slope. Precise calculation of these variables ensures the system operates within the intended parameters of the 2026 ASME B73.1 standards, protecting your infrastructure from unnecessary stress.
Generating the System Curve: Calculating TDH and Friction
Total Dynamic Head (TDH) is the absolute value required to move fluid from the intake source to the final discharge point. It's the core variable of the system curve. While the performance curve is a manufacturer's promise of capability, the system curve is your facility's operational reality. Understanding the pump system curve vs pump performance curve requires a granular look at how TDH is calculated across different flow rates. If your calculations are off, your pump will operate at a point that causes mechanical stress.
Static head represents the vertical lift and is the constant factor in your equation. It's the physical height difference between the liquid source and the highest discharge point. This value doesn't change with flow rate, meaning it serves as the Y-axis intercept on your chart. Friction head, conversely, is the dynamic resistance caused by the pipe walls and internal turbulence. It depends heavily on velocity. Because velocity is a function of flow rate and pipe diameter, a smaller pipe increases velocity and exponentially raises friction loss. This relationship dictates the steepness of the system curve slope.
Mastering the Friction Loss Variables
For industrial pipe materials, the Hazen-Williams equation remains the standard for Calculating TDH and Friction. In 2026, the C-factor for new HDPE is typically 150, while stainless steel is approximately 140. These coefficients represent pipe smoothness; a higher number indicates less resistance. In mining applications, fluid viscosity significantly impacts these calculations. Slurries or wastewater with high solids content create more internal resistance than clean water, shifting the entire curve upward. You must account for these variations to avoid undersizing your motor.
Accounting for Minor Losses in Industrial Manifolds
Don't ignore minor losses. These come from elbows, tees, check valves, and strainers. The "Equivalent Length" method treats these fittings as additional straight pipe to simplify the math. In modular containerized RO systems, compact manifolds often feature numerous fittings in a confined space. This creates significant cumulative resistance that can deviate from theoretical models. You can verify these calculations in the field using Ashcroft pressure gauges at critical junctions. Comparing gauge readings to your theoretical curve identifies where unexpected friction is occurring. For complex system validation, the engineering team at Water Services, Inc. can provide technical support to ensure your hardware matches your infrastructure requirements.
Reading the Pump Performance Curve: Beyond Flow and Head
A manufacturer's performance curve provides data far beyond simple pressure and volume. While the intersection of the pump system curve vs pump performance curve defines the duty point, secondary data on the chart dictates the machine's lifespan. Understanding these metrics prevents common industrial failures like motor burnout or shaft deflection. You must look at the shut-off head and the power curve to ensure your motor is properly sized for the entire operating range.
The shut-off head is the maximum pressure a pump generates at zero flow. It represents the highest point on the performance curve. Operating near this point causes rapid heat buildup within the casing, often leading to seal failure or warped impellers. Conversely, the power curve shows the Brake Horsepower (BHP) required as flow increases. In systems with low resistance, a pump might "run out" to the far right of its curve. This increases the load on the motor beyond its nameplate capacity, causing thermal overload trips and winding damage.
The Importance of the Best Efficiency Point (BEP)
The Best Efficiency Point (BEP) is the specific flow rate where the pump operates with maximum hydraulic efficiency. At this point, the radial forces acting on the impeller are balanced. Operating far to the left or right of the BEP increases vibration and accelerates mechanical seal wear. Goulds Water Technology Pumps are engineered to provide wider BEP ranges, offering more flexibility for dynamic industrial processes. In 24/7 operations, even a 5% deviation from the BEP can result in thousands of dollars in wasted electricity and premature maintenance intervals.
NPSHr vs. NPSHa: Protecting the Impeller
Cavitation is the primary killer of industrial impellers. It occurs when the Net Positive Suction Head Available (NPSHa) in your system is lower than the Net Positive Suction Head Required (NPSHr) by the pump. NPSHr is a fixed value provided on the manufacturer's performance curve. NPSHa is a variable you must calculate based on your site's conditions. High-altitude mining sites are particularly vulnerable because lower atmospheric pressure significantly reduces NPSHa. Signs of cavitation include:
- A distinct sound often described as "pumping gravel" or marbles.
- Unexplained pitting and erosion on the impeller vanes.
- Erratic discharge pressure and flow fluctuations.
To ensure system stability, your NPSHa should always exceed NPSHr by a safety margin of at least two feet. If your calculated margin is too thin, you may need to increase the suction pipe diameter or lower the pump's elevation. For assistance with these complex hydraulic calculations, you can consult the technical experts at Water Services, Inc. to verify your equipment selection before installation. For residential water systems that rely on these same hydraulic principles, Hydrochemistry Pools and Spas provides professional expertise to maintain efficient pool and spa pump systems.
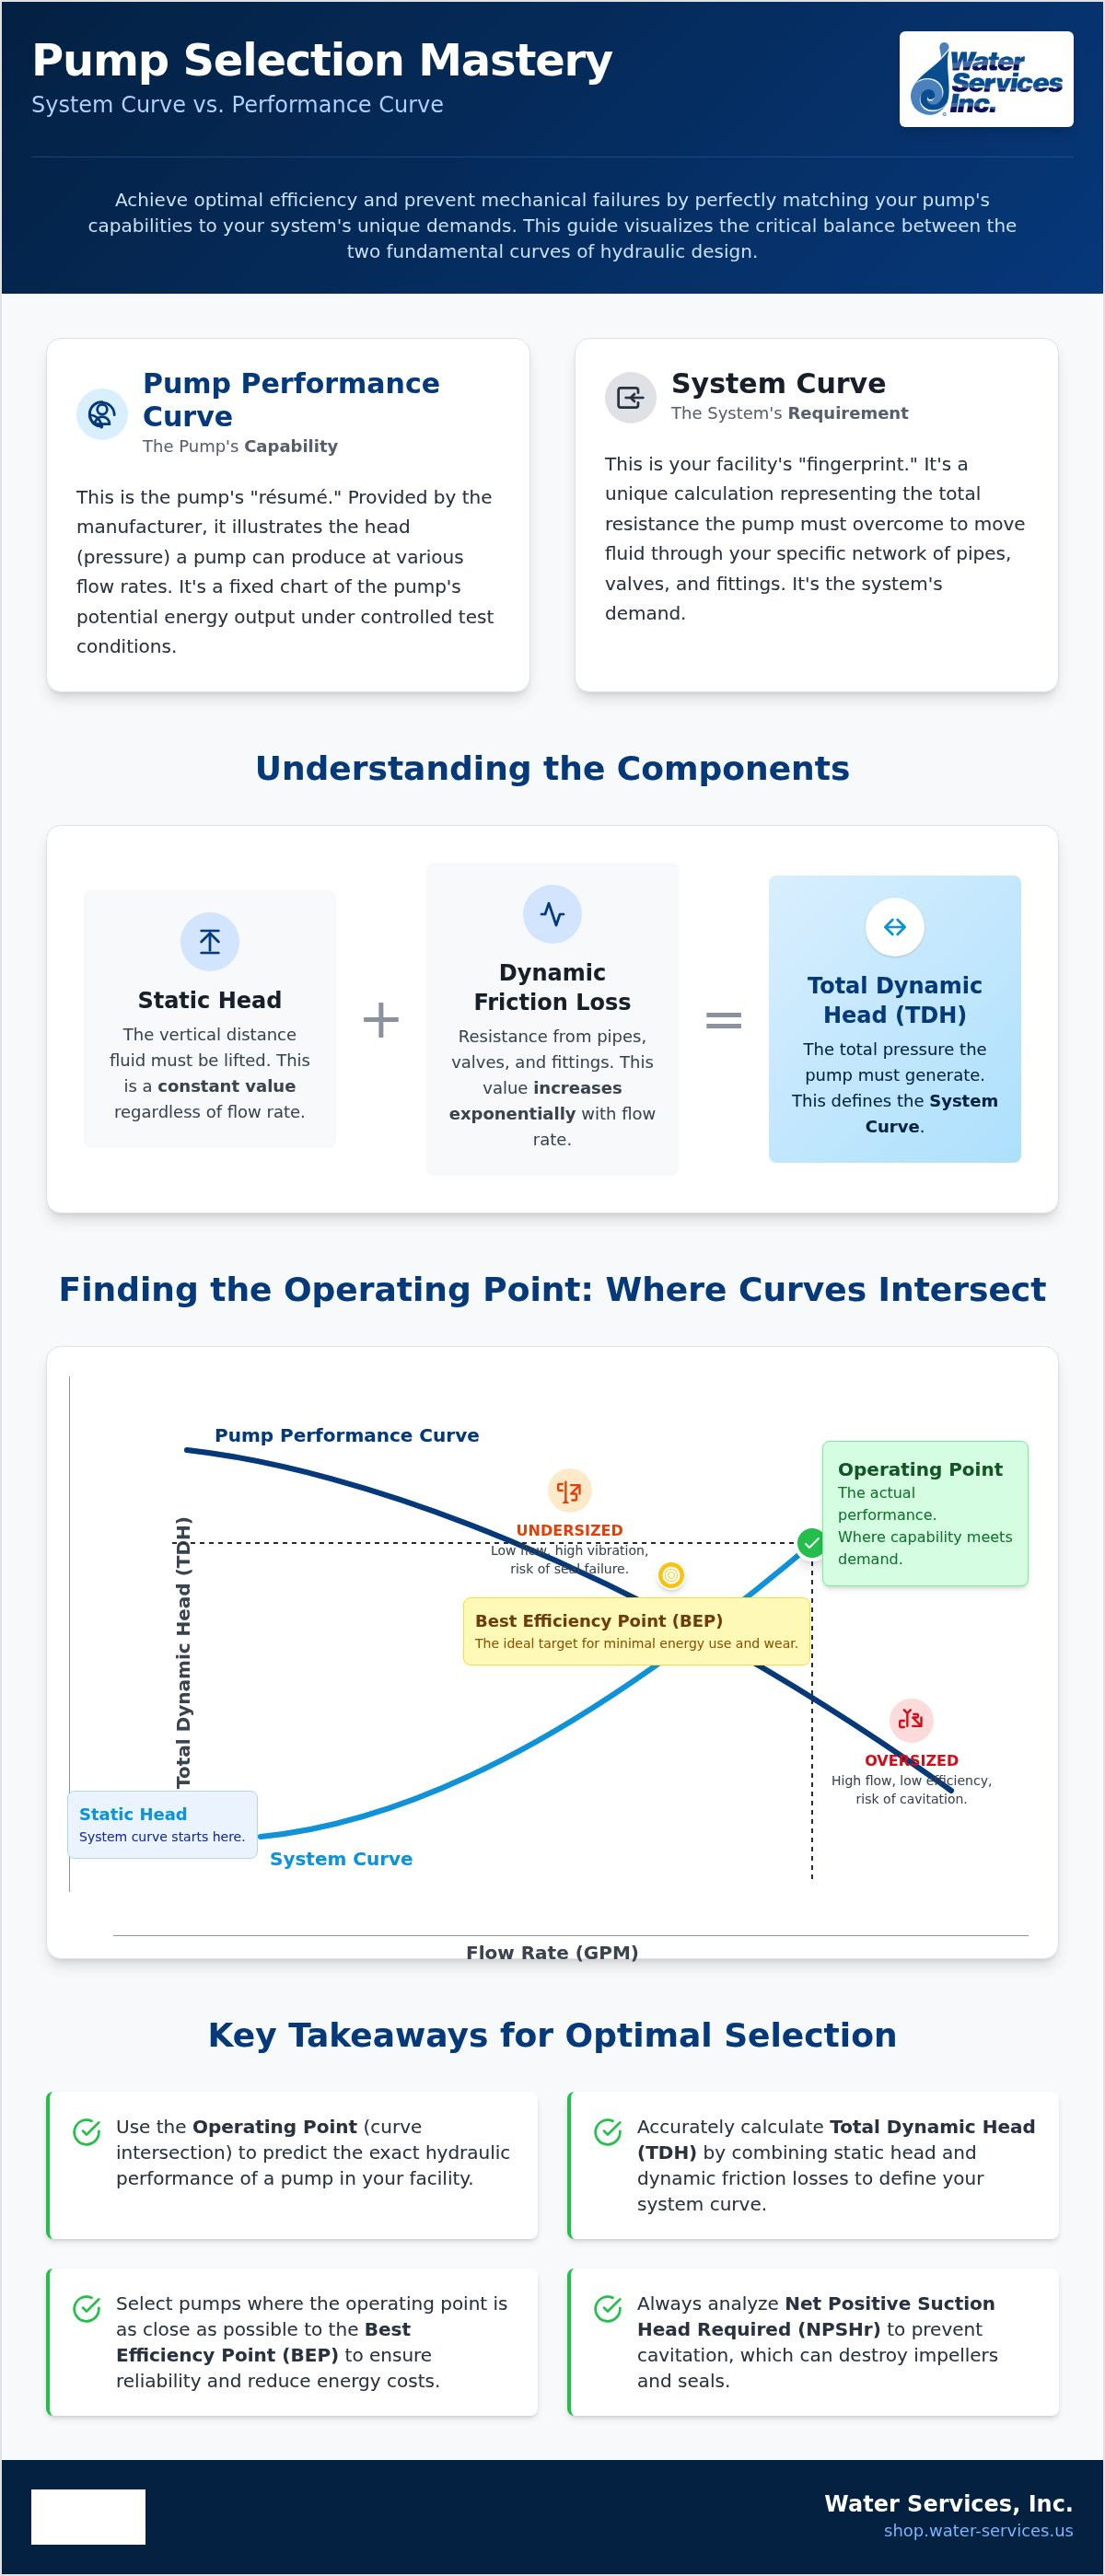
The Operating Point: Where System Curve Meets Pump Curve
The operating point is the specific coordinate on a hydraulic chart where the pump's physical output matches the system's resistance. It represents the actual flow rate and head your facility will experience during operation. In the technical evaluation of a pump system curve vs pump performance curve, this intersection represents a state of dynamic equilibrium. To identify this point, you must plot your calculated system curve, which includes static head and dynamic friction, directly onto the manufacturer's performance data sheet. If the intersection falls too far from the Best Efficiency Point (BEP), your system is improperly balanced.
Operational control methods significantly alter this point. Throttling a discharge valve adds artificial resistance, which steepens the system curve and forces the operating point to the left. While this reduces flow, it increases energy waste and mechanical heat. A more efficient alternative involves Variable Frequency Drives (VFDs). A VFD changes the pump's rotational speed, which shifts the entire performance curve downward or upward. This allows you to meet varying process demands without the mechanical stress associated with valve throttling.
Dynamic Changes: Scaling, Corrosion, and Aging
Industrial infrastructure is subject to constant degradation. Pipe aging in 2026 systems often leads to internal scaling and corrosion, which increases the roughness of the pipe walls. As the C-factor decreases, friction losses rise, causing the system curve to steepen over time. This shift moves the operating point toward a lower flow rate and higher head than originally designed. Integrating water treatment chemicals and antiscalants helps maintain internal pipe smoothness, preserving the original design efficiency. For real-time oversight, Walchem controllers allow operators to monitor performance shifts and adjust chemical dosing based on actual flow data.
Parallel and Series Pumping Considerations
Complex industrial configurations often require multiple pumps. Parallel pumping involves two or more pumps discharging into a common header to increase total flow capacity. On a hydraulic chart, this results in a horizontal shift of the performance curve. Series pumping, however, stacks the head of each pump to overcome extreme vertical static lift, resulting in a vertical shift. Operators must be cautious of "dead-heading," which occurs if the system pressure exceeds the shut-off head of one of the pumps in the configuration. To ensure your multi-pump setup is hydraulically sound, select Goulds Water Technology Pumps with compatible performance profiles to avoid mechanical interference.
Industrial Selection: Integrating Goulds Pumps and Modular Systems
Selecting the correct hardware requires a final synthesis of the pump system curve vs pump performance curve data. Once you have established the Total Dynamic Head (TDH) and required flow rate, you must cross-reference these values with the Goulds Water Technology Pumps catalog. The objective is to identify a model that places your operating point within the 80% to 110% range of the Best Efficiency Point (BEP). This ensures the pump operates with minimal radial thrust, protecting the bearings and mechanical seals from premature failure.
Material selection is equally critical for industrial longevity. For high-purity water or corrosive mining applications, 316 stainless steel components are required to resist pitting and chemical degradation. Standard cast iron configurations are suitable for non-corrosive industrial water but lack the durability required for specialized wastewater treatment. Modular industrial water treatment systems depend on this precise alignment to maintain membrane flux and prevent system-wide pressure drops that can compromise water quality.
Custom Engineering for Mining and RO
Engineering for remote locations, such as mining sites in Africa and the Middle East, introduces logistical variables like extreme ambient temperatures and limited power stability. Designing a commercial reverse osmosis water filtration system requires balancing the high-pressure needs of the RO membranes against the system curve of the distribution manifold. These containerized plants must be robust and easy to maintain. Ensuring site safety is also a priority; operators should always utilize appropriate PPE for industrial operators when handling high-pressure fittings or specialized water treatment chemicals.
Final Verification and Commissioning
Theory must be validated by field data. During commissioning, utilize ultrasonic or magnetic flow meters to confirm the actual operating point matches your plotted pump system curve vs pump performance curve analysis. Discrepancies often indicate unexpected minor losses or incorrect pipe diameter assumptions. Consulting with the experts at Water Services, Inc. provides a final layer of technical verification to ensure your pump specification meets the demands of 2026 industrial standards. Establish a rigorous maintenance schedule based on this performance data. Monitor for shifts in vibration or power consumption, as these are early indicators that the system curve has shifted due to internal fouling or mechanical wear.
Optimizing Hydraulic Infrastructure for Long-Term Reliability
Achieving hydraulic balance requires more than a cursory glance at a data sheet. You must master the relationship between the pump system curve vs pump performance curve to ensure your facility operates at peak efficiency while avoiding the mechanical stress of cavitation or motor overload. Accurate TDH calculations and a deep understanding of the Best Efficiency Point allow you to maintain infrastructure integrity in demanding environments. These technical foundations prevent the energy waste and premature failures that compromise industrial productivity.
Water Services, Inc. serves as an authorized Goulds Water Technology distributor with over 30 years of industrial water engineering expertise. We specialize in providing reliable components and modular containerized solutions for the global mining and military sectors. Whether you're designing a new manifold or troubleshooting an existing system, our technical support ensures your hardware matches your specific hydraulic demand. Precision in selection is the most effective way to guarantee operational stability.
Browse our selection of Goulds Water Technology Pumps to find the exact model for your application. Proper selection today prevents costly downtime tomorrow. Your system's reliability depends on this technical precision, and we're here to support your engineering requirements.
Frequently Asked Questions
What is the simplest way to explain a system curve vs. a pump curve?
A pump performance curve represents the potential energy and flow a specific machine can provide at a given speed. The system curve represents the resistance, including static head and friction, that the fluid must overcome. The intersection of the pump system curve vs pump performance curve identifies the actual duty point. This comparison is the standard method for ensuring your equipment matches the hydraulic requirements of your facility.
How does pipe diameter affect the slope of my system curve?
Smaller pipe diameters increase fluid velocity, which creates higher friction loss and results in a steeper system curve slope. Conversely, larger diameters reduce velocity and friction, flattening the curve. This shift directly moves your operating point. Selecting an undersized pipe forces the pump to work against higher resistance, often leading to increased power consumption and reduced flow rates in complex industrial manifolds.
What happens if my operating point is too far to the right of the BEP?
Operating too far to the right of the Best Efficiency Point (BEP) causes the pump to "run out," leading to high vibration and potential motor overload. This condition increases the Net Positive Suction Head Required (NPSHr), which often triggers cavitation. It also places excessive radial loads on the shaft and bearings. Maintaining a duty point near the BEP is critical for the longevity of high-performance industrial equipment.
Do I need to recalculate my system curve if I change my pipe material?
Yes, you must recalculate the system curve because different materials have different Hazen-Williams C-factors. For example, switching from aged cast iron to new HDPE significantly reduces internal friction. This change flattens the system curve and shifts the operating point to a higher flow rate. Failure to account for material smoothness can result in an improperly balanced system that operates outside the pump's intended design range.
How do I convert PSI to feet of head for my system curve calculation?
To convert PSI to feet of head, multiply the PSI value by 2.31 and divide by the specific gravity of the fluid. For standard water at 60°F with a specific gravity of 1.0, the calculation is simply PSI x 2.31. This conversion is necessary to plot your system resistance on the same Y-axis as the manufacturer's performance curve, ensuring all metrics are consistent for accurate duty point identification.
Can a pump operate at any point on its performance curve?
Technically, a pump can operate at any point on its curve, but it should only operate within the Preferred Operating Region (POR). Operating near the shut-off head causes internal heat buildup and shaft deflection. Operating at the far right leads to cavitation and motor damage. For optimal reliability, engineers target the 80% to 110% range of the Best Efficiency Point to minimize mechanical wear and maximize energy efficiency.
Why is NPSHr important when comparing these two curves?
NPSHr is critical because it defines the minimum pressure required at the suction port to prevent cavitation. When analyzing the pump system curve vs pump performance curve, you must ensure the system's available head (NPSHa) always exceeds the pump's requirement. If the operating point shifts to a higher flow rate, the NPSHr increases significantly. Failure to monitor this relationship leads to impeller pitting and catastrophic seal failure.
How does fluid density in mining applications affect the pump curve?
Fluid density does not change the head a centrifugal pump produces, but it directly impacts the Brake Horsepower (BHP) required. In mining applications, heavy slurries with high specific gravity require more power to move the same volume of fluid compared to clean water. While the performance curve for head remains the same, you must adjust the power curve calculations to avoid overloading the motor during continuous industrial operations.
0 comments